Modelling Rate Problems
It is often said that "Australia is the driest continent in the world".
It might not seem like it recently, as we have had 110% of the 2019 annual
rainfall already in May. So when we look at a water rate, we have a number
of interestin STEM problems. Let's look at the Mathematical part in this
problem.
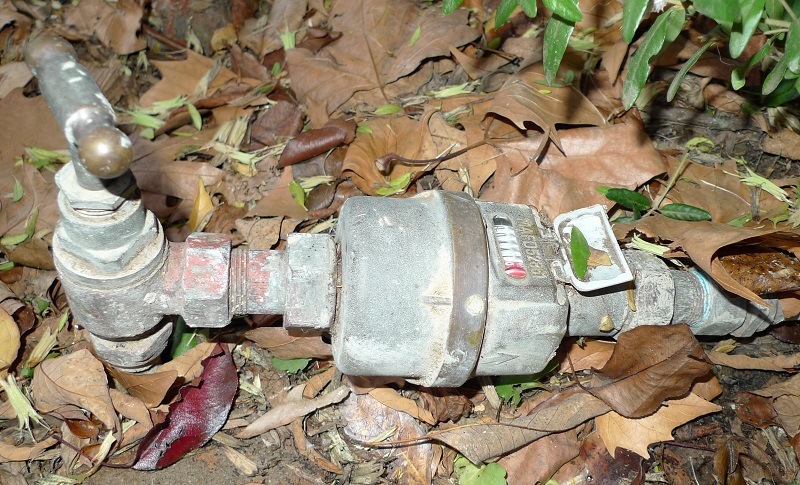
- A photograph of the water meter that measured the flow of water
shown in the "rate notice" below.
- Note that this meter is read
when somebody walks past the house, ducks under the bushes and finds
the meter.
|
 |
- This water "rate" notice was for 89 days between February 2020
and May 2020
|
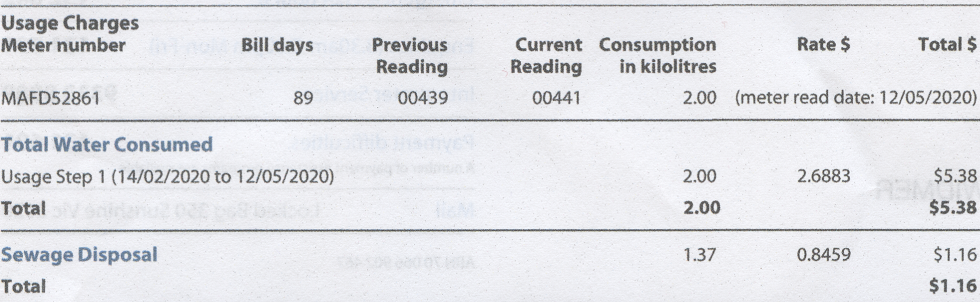 |
Questions Related to the Rate Notice
- What was the total amount of water (in litres ) was used at this house
during these three months?
- What was the daily rate of water consumption (per day ) for this house?
( Hint: divide the total amount by the number of
days )
- What was the daily cost of the water consumption at this house? (Hint:
similar method to the one above)
- What would be a better STEM solution to problem of measuring and billing
water consumption? ( Hint: Look at this
web page )
- Oh .. If you missed last week's questions ...
look here!