Project planning is widely used in the software and construction industries. It is a way of breaking a large project into smaller manageable tasks. A project that might take more than one day is analysed by its different tasks. One way of visualizing this planning is to use a Gannt chart.
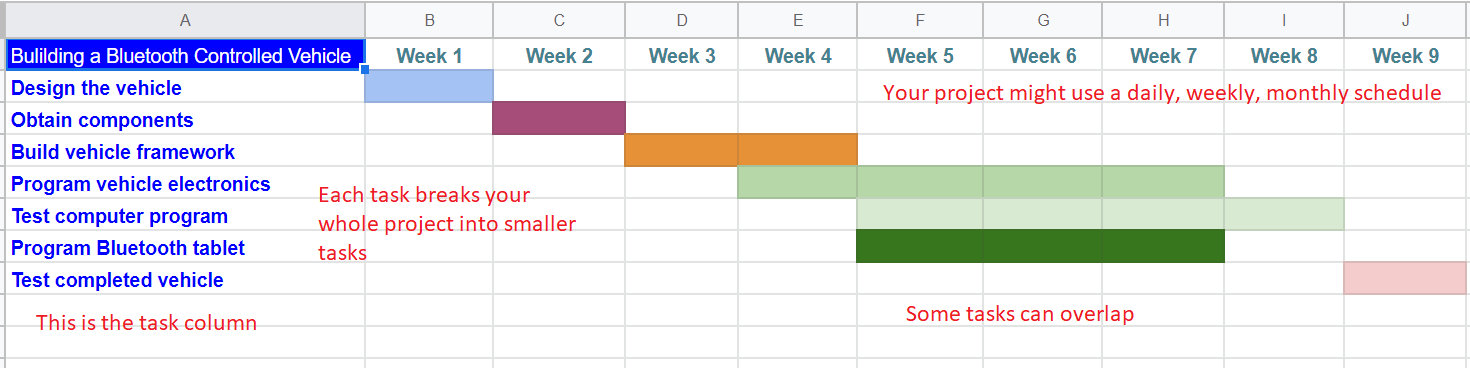
Gannt charts are named after their inventor. They have been used in industry for more than 100 years. The development of personal computers in the 1980's lead to the widespread use of these charts. The computer version of the Gannt chart was easily edited. Google docs and Excel are both used to create Gannt charts. The chart illustrated here is one that was used to develop a remotely controlled vehicle.
|
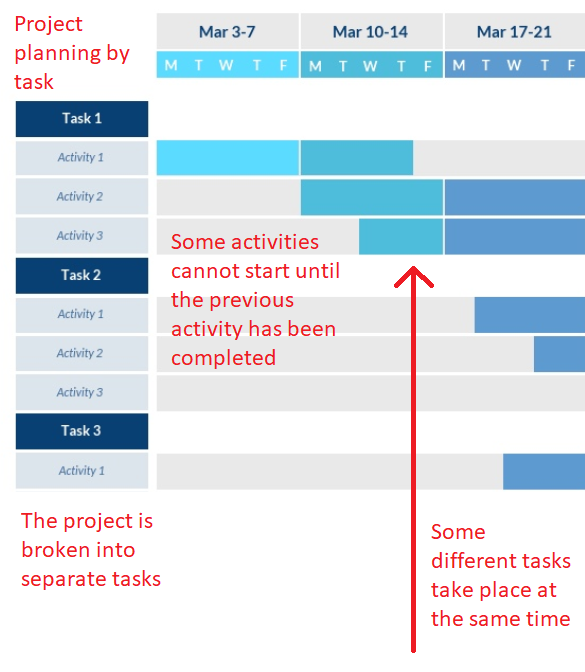 Tasks and Activities