In this activity we will investigate lines on a coordinate system.
- Load this Geogebra file
You should see this graph.
|
 |
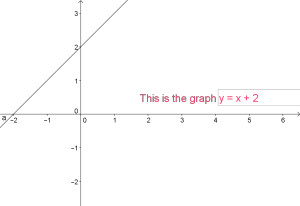
- Now type in the new equation y = x + 2
You should see the graph move upwards
|
|
|
Questions |
- What happened to the line when you added 2 to the equation?
- What do you expect will happend when you subtract 2 from the
equation y = x?
|
|
Activities |
- Change the equation to show the lines formed by y = x2
- Save your edited shape in your "Maths is boring" folder.
- Email a copy of your Geogebra shape to your teacher.
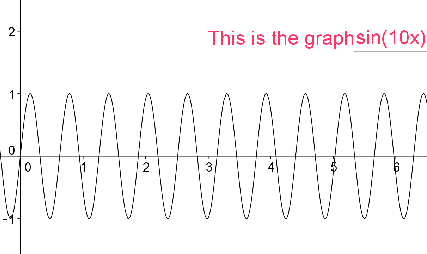
- Do you think
this graph
is like the other graphs?
|